I wanted to take a moment to jot down a few cool impressions on VMware’s new vCenter Log Insight. vCenter Log Insight was recently announced, and is initially available in beta – but still providing a number of very cool features and integration with vCenter Operations Manager.
I want to first highlight the easy to use query language. In this example we are investigating an intermittent SCSI / latency problem – using the power of logs, we were able to quickly find the common “unstructured” data thread. I liked this simplistic approach rather than having to learn and support a complex / proprietary query language as in other tools.
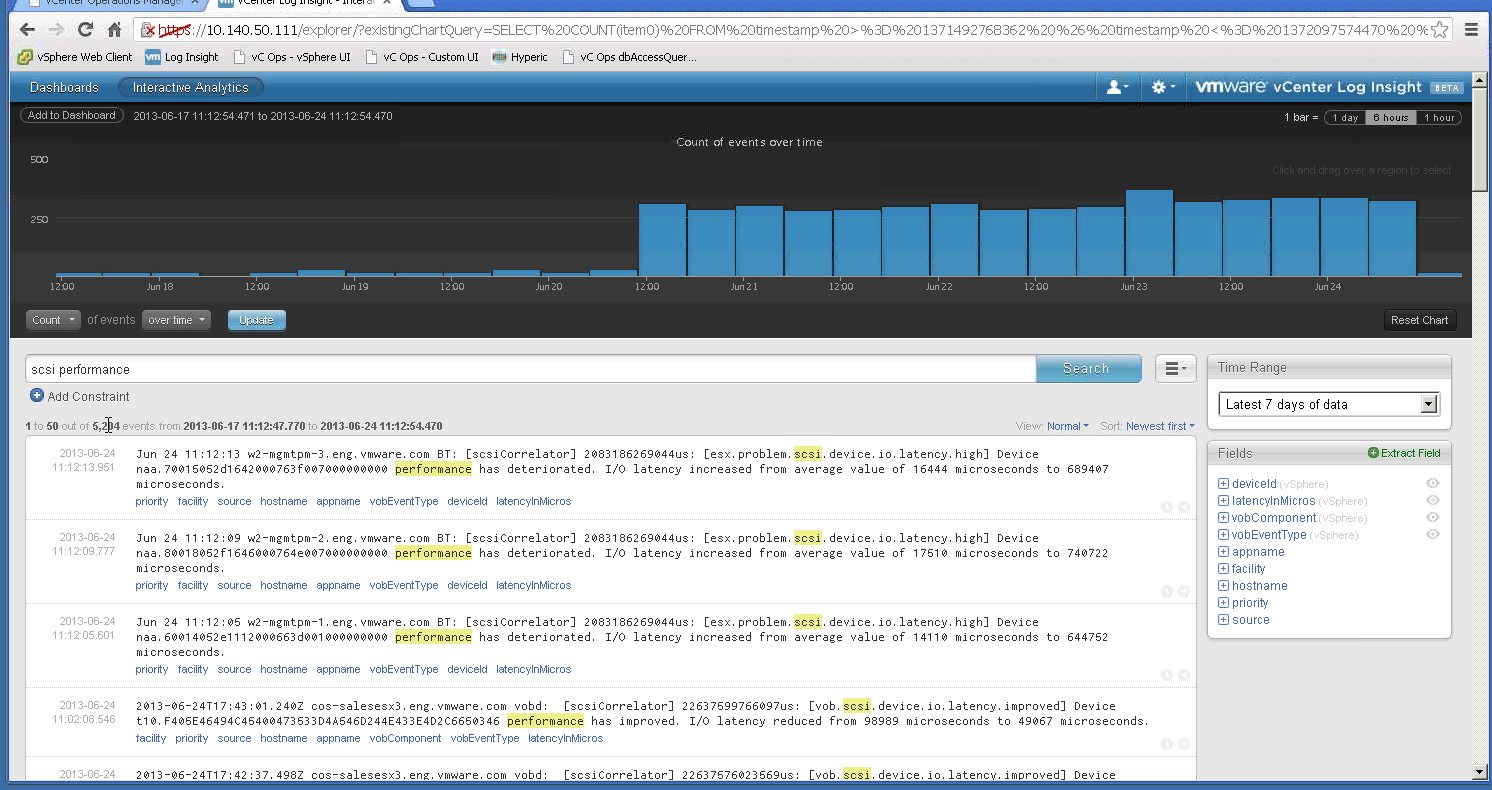
By simply entering “SCSI performance deteriorated” we start to pick-up quite a bit of data and I can see the frequency these events have hit, as well as the spike at June 20, @ 12pm– now I can start refining this query to fit my needs.

I can even drill-down using linked “extracted fields”, as well as extract additional fields based on how you wish to refine your query making it repeatable and easy to use/learn.
Next, it would be helpful to understand things like average SCSI latency over time – refining the query even further you, can choose “average” function over a specified period of time.

Furthermore this may be a query that you may want to run multiple times, therefore you can add it to a new, or existing dashboard. Also adding constraints, or thresholds, gives the user the ability to monitor queries and filter out data that is not significant.
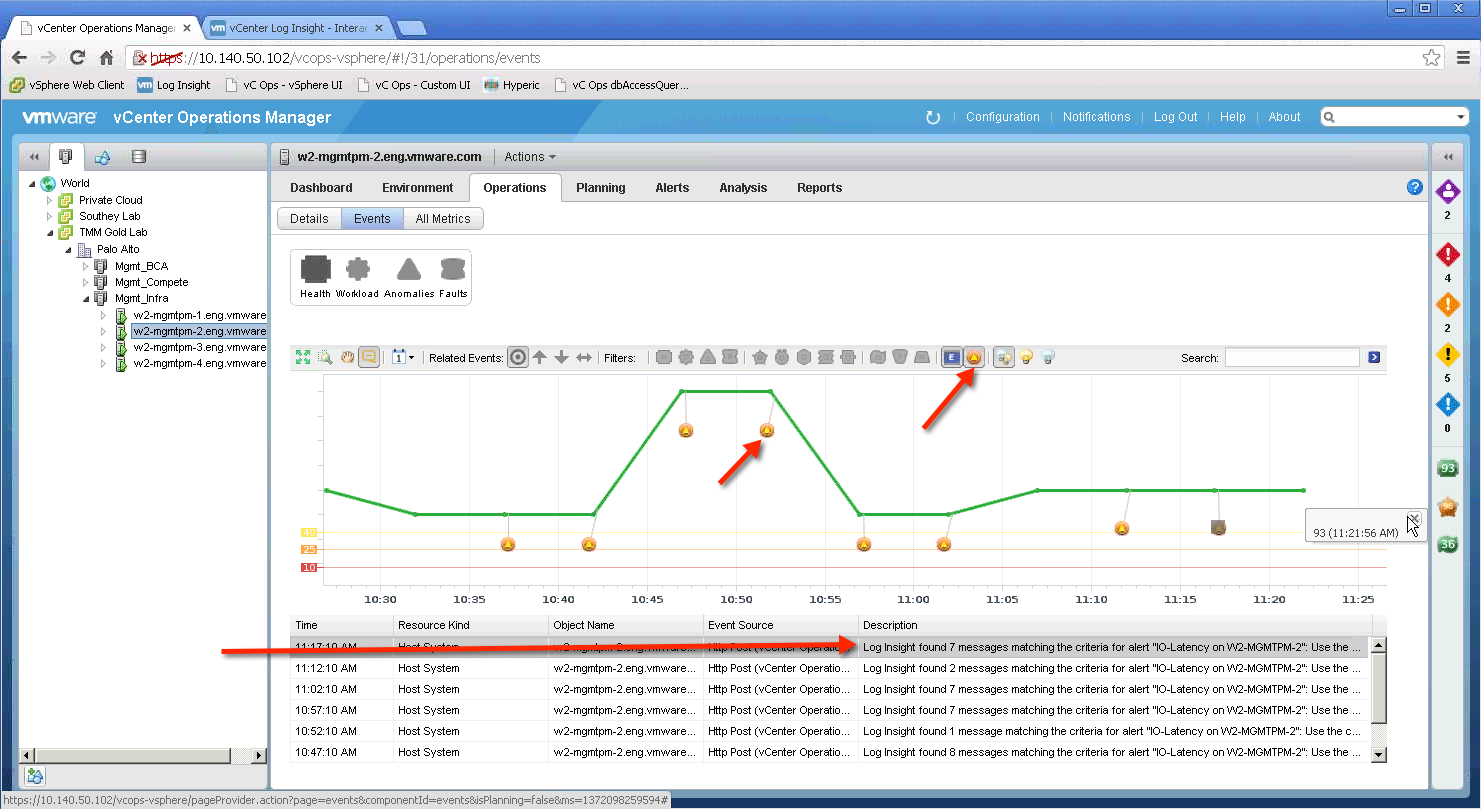
Finally, and this is the cool part, vCenter Operations Manager integration allows Log Insight data to vCOps, giving a single view into the structured and unstructured performance data allowing for a more comprehensive and accurate view of your virtualized / cloud and supporting physical infrastructure.
For more information check out the vCenter Log Insight product web page and view the introduction video.
@benscheerer


